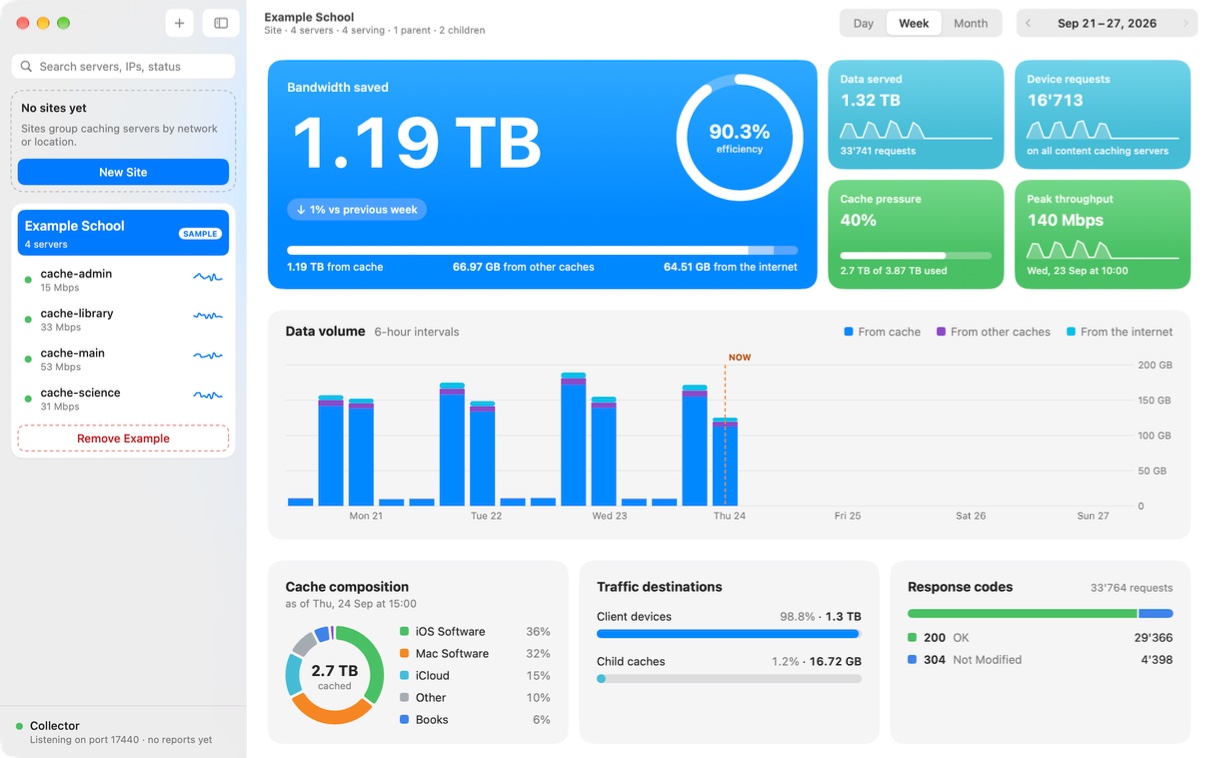
The whole fleet at a glance.
Group caching servers by school, office, campus or site and see every server's state immediately: active, idle, stale or offline. Move from the whole fleet to one site or one server and the entire dashboard follows.

Monitor every Apple content caching server across your organisation — privately, from a single Mac.
Content Caching Monitor turns the status reports built into macOS 27 into a live view of your entire caching fleet: data served, bandwidth saved, cache pressure, throughput and server health.
Reports travel directly from your caching servers to your Mac and stay there, without sending details about your environment — hostnames, addresses, serial numbers and usage patterns — to an external service.
No cloud. No account. No telemetry.
Content Caching Monitor
Apple Content Caching can save an organisation terabytes of internet traffic by serving system updates, apps and iCloud content locally. But macOS offers very little visibility into what each cache is doing — and even less across multiple buildings or sites.
Content Caching Monitor brings every server together in one native Mac app. See how much data your caches delivered, how much external bandwidth they saved, where capacity is running low and which servers need attention.
All without sending your infrastructure data to somebody else's cloud.
Group caching servers by school, office, campus or site and see every server's state immediately: active, idle, stale or offline. Move from the whole fleet to one site or one server and the entire dashboard follows.
See data served, bandwidth saved, cache utilisation and peak throughput, with traffic views by hour, six hours or day. Warnings highlight cache pressure and saturated links before they become problems.
Caching servers report directly over your network to your Mac, where everything is stored locally. No account, no sign-in, no analytics — and no server operated by us ever receives your data.
Every new caching server has to be paired before its reports are stored. Compare the verification code, approve the server, and only then does monitoring begin. Unapproved servers are ignored.
macOS normally sends each status report only once. If your monitoring Mac is unavailable, that report is lost. The optional agent keeps reports safely on the caching server and delivers them when your Mac returns — even days later.
Prometheus metrics and ready-made Nagios checks are built in. Monitor silent servers, missing reports, cache pressure and other conditions using the alerting infrastructure you already have.